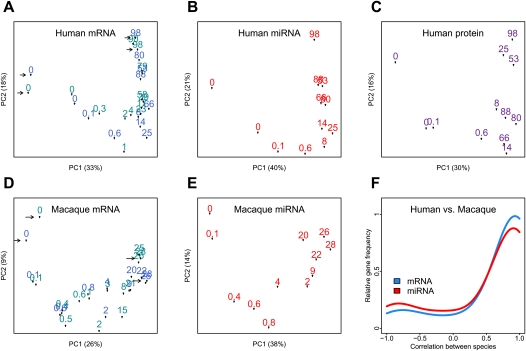
Figure 1.
mRNA, protein, and miRNA expression changes during life span. (A–E) The first two principal components of mRNA, miRNA, and protein expression in human and rhesus macaque brains. The analysis was performed by singular value decomposition, using the “prcomp” function in the R “stats” package, with each gene scaled to unit variance before analysis. The numbers represent each individual's age in years. The proportion of variance explained by each principal component is shown in parentheses. For mRNA, arrows indicate pairs of technical replicates, and shades of blue represent two experimental batches. Individuals group according to their age, indicating a substantial influence of age on total expression variation. (F) Distribution of Pearson correlation coefficients between human and macaque expression time series, calculated for 3233 orthologous mRNAs (blue) or 98 orthologous miRNAs (red), showing significant expression change with age in human (Supplemental Text S1). The y-axis shows the relative frequency (the Gaussian kernel density estimate, calculated with the R “density” function) of genes showing a certain Pearson correlation coefficient.

