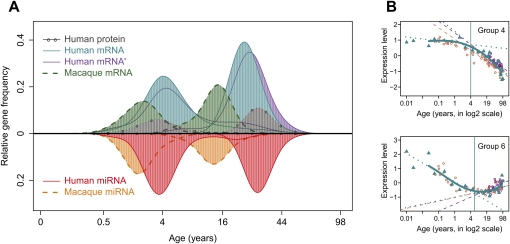
Figure 3.
Transition points of expression change with age for mRNA, miRNA, and proteins. (A) The age distribution of expression transition points determined on gene-by-gene basis. The y-axis shows the relative frequency (the Gaussian kernel density estimate, calculated with the R “density” function) of genes showing a certain transition point. The x-axis shows transition ages on the (age)¼ scale. (Blue) Human mRNA; (green) macaque mRNA; (purple) a published human mRNA data set (Somel et al. 2009); (gray) human protein; (red) human miRNA; (orange) macaque miRNA. Only age-related genes following nonlinear trajectories and showing significant transition points are represented (Supplemental Table S3). (B) The transition point identification procedure illustrated using genes in groups 4 and 6 (as shown in Fig. 2A). The y-axes indicate mean normalized expression levels of genes in the group. The x-axes show individuals' ages in log2 scale, allowing improved resolution of developmental changes (Methods; Supplemental Fig. S14). Blue points represent expression levels from the human mRNA data set; blue solid lines show spline curves fit to these data. Blue vertical lines show the transition points. Dotted blue lines show linear regression of expression on age before and after the transition point. Purple and brown points/lines represent mean expression levels/linear regression lines from two published data sets (Lu et al. 2004; Somel et al. 2009), respectively. Note that the results shown in A are calculated per gene, and in B using the means of gene groups.

