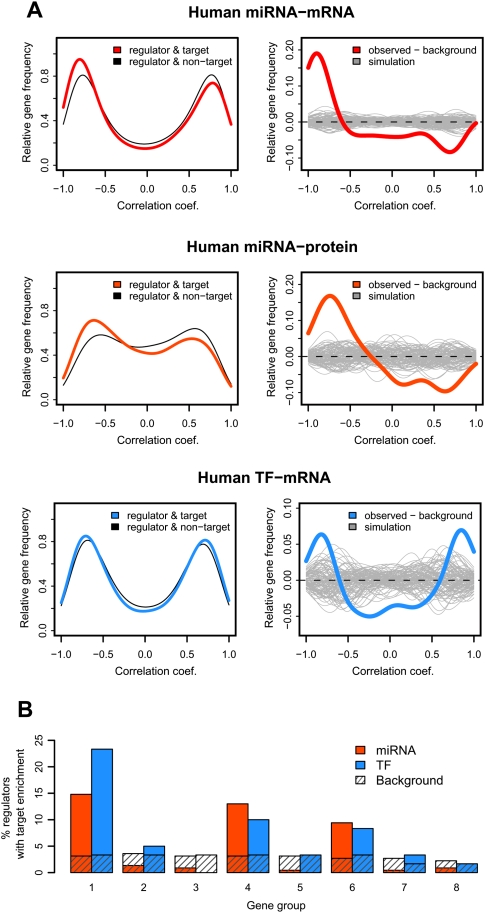
Figure 4.
miRNA and TF regulation of expression changes with age. (A) Excess of negative correlations between miRNA/TF–target pairs. (Left panels) The y-axes show the relative frequency (the Gaussian kernel density estimate, calculated with the R “density” function) of Pearson correlation coefficients. Shown are correlations between expression profiles of age-related regulators (miRNA or TF) and their age-related target genes (Methods). Colored curves represent the distribution of regulator–target correlations for miRNA–mRNA (red), miRNA–protein (orange), and TF–mRNA (blue). Gray curves show the background distribution: correlations between regulators and non-targets (genes with no evidence of being targeted by the respective regulators). (Right panels) The difference between the kernel density distributions of regulator–target correlations and the background. The gray lines represent 100 simulation results, generated by randomly selecting the same number of background pairs, as regulator–target pairs. The bimodality of the correlation coefficient distributions is because we calculate correlations between age-related regulators and targets only; so, each pair shows some degree of correlation, positive or negative. We therefore test the excess of negative correlations for predicted miRNA–target pairs, relative to randomly paired age-related miRNA and mRNA. Similarly, we test the excess of strong positive and negative correlations for the predicted TF–target pairs (given the dual role of TFs as activator and/or repressor of transcription), relative to randomly paired age-related TFs and mRNA. (B) The proportion of expressed miRNA or TFs showing target enrichment among eight coexpressed gene groups (at HT, P < 0.05).

