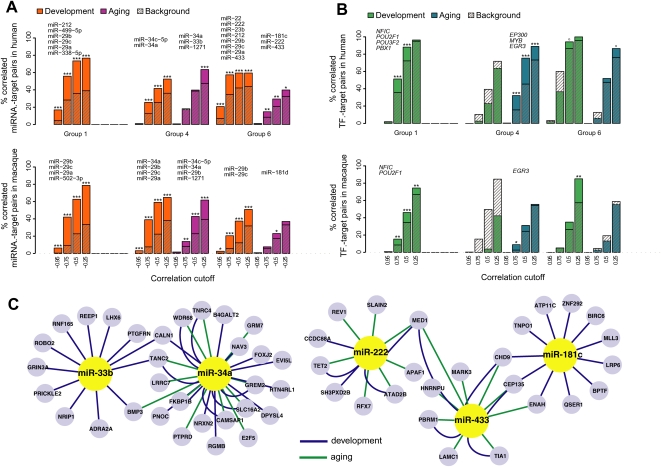
Figure 5.
miRNA and TF regulation in development and aging. (A) Excess of negative correlations among selected miRNA–target pairs in three coexpressed gene groups in human or macaque cortex. The colored bars show the proportions of negative correlations among miRNA with significant target enrichment within a gene group (at HT, P < 0.05) and their targets in that group at different correlation cutoffs. Hatched bars indicate the proportions of negative correlations among miRNA without target enrichment in a gene group and their targets in that group (the background). The asterisks indicate support for observed–background difference, calculated by bootstrapping the background set 1000 times; ***P < 0.001; **P < 0.01; *P < 0.05; o P < 0.10. Both observed and background correlations are calculated separately for developmental and aging periods. The names of identified putative regulatory miRNA are shown above each gene group. Genes in group 1 show limited expression change during aging; therefore, we do not estimate regulators for this group at this period. For macaque, regulators shown in the figure are predicted based on the macaque data and independently of human analysis results, using the same significance levels. Additionally, ∼80% of regulators predicted in humans show a tendency for negative correlation with their targets in macaques (Supplemental Table S5). (B) Excess of negative and positive correlations among TF–target pairs in three gene groups. The colored and hatched bars represent proportions of observed and background TF–target gene correlation pairs, as in B, but the x-axis shows the absolute Pearson correlation cutoff. The names of identified putative regulatory TFs are shown above each gene group. (C) A network of regulatory interactions identified in groups 4 and 6. Only part of the full network, listed in Supplemental Table S5, is shown. The represented genes are those containing the specific miRNA binding site and that show significant negative correlation with that miRNA's expression profile, either in development (green edges) or aging (blue edges). The figure was drawn using Cytoscape software (v 2.6.3).

