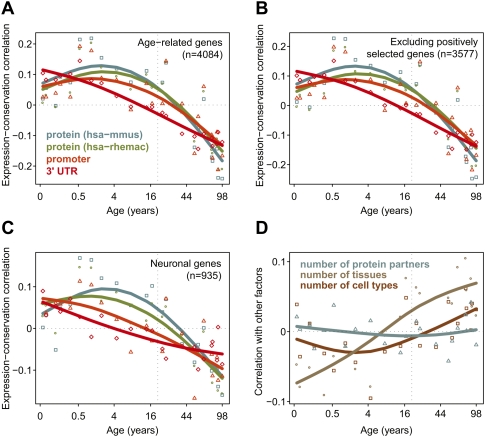
Figure 7.
Diminishing stabilizing selection pressure with age. (A) The symbols and fitted spline curves show the stabilizing selection scores (SSS) calculated for protein coding (blue and green), promoter (orange), and 3′-untranslated (UTR) (red) regions (Methods). The SSS indicate correlation between conservation values and standardized expression levels per individual, across 4084 age-related genes. Conservation scores are corrected for variation in mutation rates. The x-axis shows age of individuals on the (age)¼ scale. Positive SSS indicate above-average correlation between expression levels and sequence conservation among genes, at a certain age. The dashed vertical line indicates 20 yr of age, when brain maturation is largely complete (de Graaf-Peters and Hadders-Algra 2006). (B) Same as A, but excluding genes possibly under positive selection (Methods). (C) Same as A, but only using genes with enriched expression levels in neurons. (D) Correlation between standardized expression levels and potential confounding factors across age-related genes: number of protein–protein interaction partners (blue), number of tissues (gray) or cell types (brown) a gene is expressed in (i.e., expression breath).

