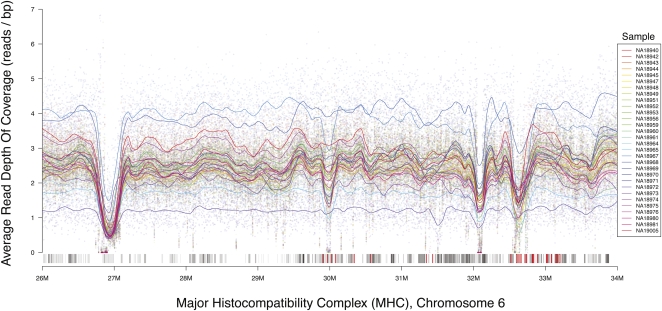
Figure 3.
MHC depth of coverage in JPT samples of the 1000 Genomes Project pilot 2, calculated using the GATK depth of coverage tool. Coverage is averaged over 2.5-kb regions, where lines represent a local polynomial regression of coverage. The track containing all known annotated genes from the UCSC Genome Browser is shown in gray, with HLA genes highlighted in red. Coverage drops near 32.1 M and 32.7 M correspond with increasing density of HLA genes.

