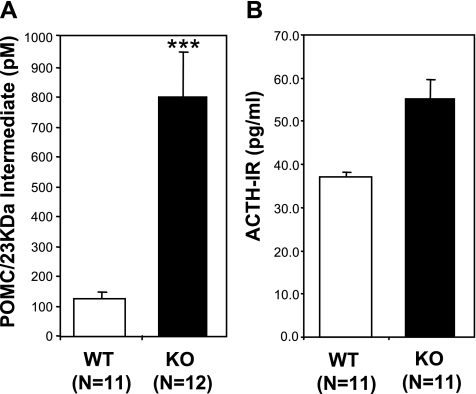
Fig. 6.
A: ELISA analysis of serum from WT and CPE KO mice specifically for full-length POMC and its biosynthetic intermediates. Bar graph shows 8 times as much POMC/intermediate in sera from CPE KO mice compared with WT, ***P < 0.001. B: RIA analysis of WT and CPE KO serum for ACTH-IR. Bar graph shows a slight but nonsignificant increase in ACTH-IR in sera from CPE KO mice.

