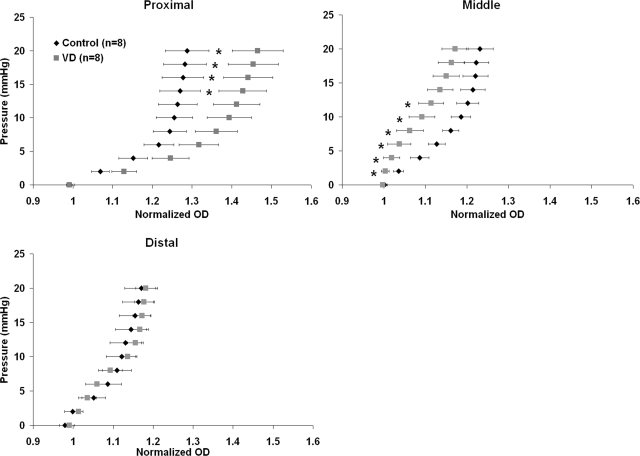
Fig. 2.
Pressure-diameter curves generated in the active state (after precontraction with PE) for the proximal (top, left), middle (top, right), and distal (bottom) segments in control and VD preparations. Error bars represent SE. Proximal control urethras were significantly stiffer in pressures ranging from 14 to 20 mmHg (indicated by *P < 0.05). Middle control urethras were significantly more compliant than VD middle segments from 2 to 12 mmHg (indicated by *P < 0.05).

