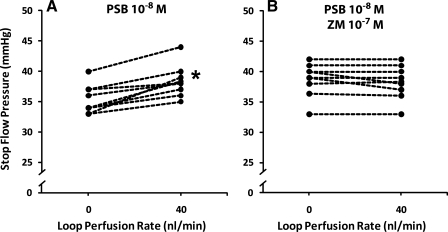
Fig. 3.
Change in proximal PSF in response to increased perfusion of loop of Henle from 0 to 40 nl/min. Broken lines represent individual nephrons. The maximal TGF response was studied after 5 min of intratubular pretreatment (10 nl/min) with A1 receptor antagonist [PSB-36 (PSB); 10−8 mol/l] (A) or with the combination of A1 (PSB-36; 10−8 mol/l) and A2A [ZM-241385 (ZM); 10−7 mol/l] receptor antagonists (B). *P < 0.05 compared with proximal PSF, at 0 nl/min, within each group (paired t-test).

