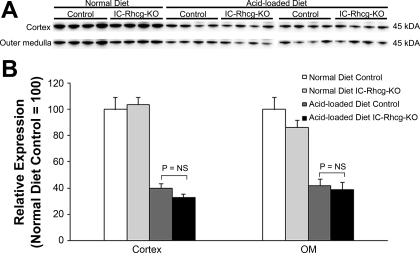
Fig. 10.
Glutamine synthetase (GS) expression in normal and acid-loaded IC-Rhcg-KO and C kidneys. A: immunoblot analysis of GS expression in the cortex and OM of IC-Rhcg-KO and C mice on a normal diet and when acid loaded. B: quantification of GS protein expression. GS expression did not differ significantly between C and IC-Rhcg-KO mice when on normal diet. Acid loading decreased GS expression compared with a normal diet, but there was no significant difference in GS expression in acid-loaded C and IC-Rhcg-KO mice in either the cortex or OM. Values are means ± SE; n = 4/group on a normal diet and n = 8/group on an acid-loaded diet. Results normalized to control mice on a normal diet was equal to 100.

