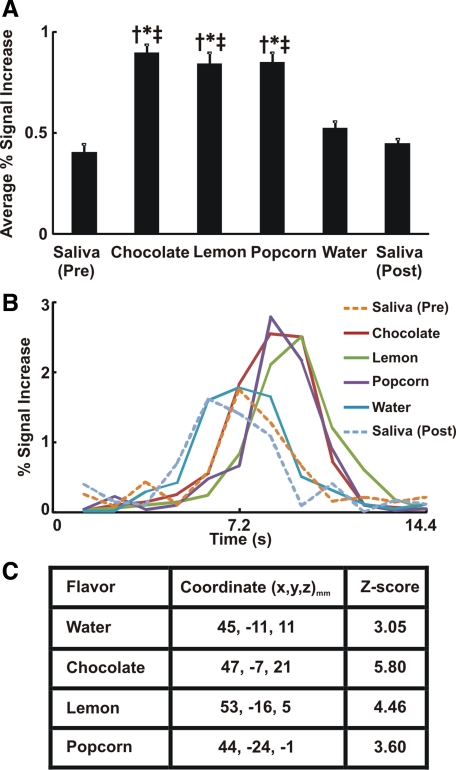
Fig. 3.
Swallow-related cortical activity in prefrontal cortex. A: average percent signal increase in prefrontal cortex. Average fMRI signal intensity for all flavored swallows was significantly different from that for dry/water swallow. We performed ANOVA and Tukey's post test for multiple pair-wise comparisons. †P < 0.001 vs. dry swallow (pre). *P < 0.01 vs. water. ‡P < 0.001 vs. dry swallow (post). Values are means ± SE. B: average swallow-related BOLD response waveform across all trials in prefrontal cortex (n = 294). Note considerable differences in magnitude of fMRI activity waveforms for the flavor-stimulated swallows compared with dry swallow and water. C: coordinates of peak signal intensity with each flavor within prefrontal cortex based on the Talairach-Tournoux system, with x, y, and z as described in Fig. 1 legend. Corresponding Z score of peak activity voxel with each flavor is also presented.

