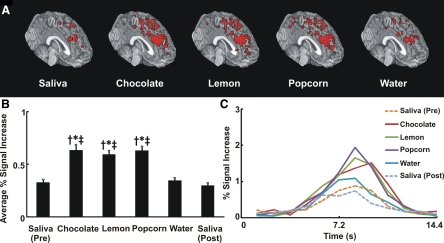
Fig. 6.
Total cortical swallowing network activity. A: activated cortical regions during swallow showing total cortical swallowing network. Significant activity associated with each stimulus throughout cortical swallowing network from medial anterior oblique view of a glass brain (all the activity is seen through the tissue). Note more robust activity with flavor-associated swallows than with saliva or water swallows. B: average percent signal increase in cortical swallowing network. Average fMRI signal intensity change for all flavored swallows was significantly different from that for dry/water swallow. We performed ANOVA and Tukey's test for multiple pair-wise comparisons. †P < 0.001 vs. dry swallow (pre). *P < 0.001 vs. water. ‡P < 0.001 vs. dry swallow (post). Values are means ± SE. C: average swallow-related BOLD response waveform across all trials in cortical swallowing network (n = 294). Magnitude of fMRI activity waveforms for the flavor-stimulated swallows was considerably different from that for dry swallow and water.

