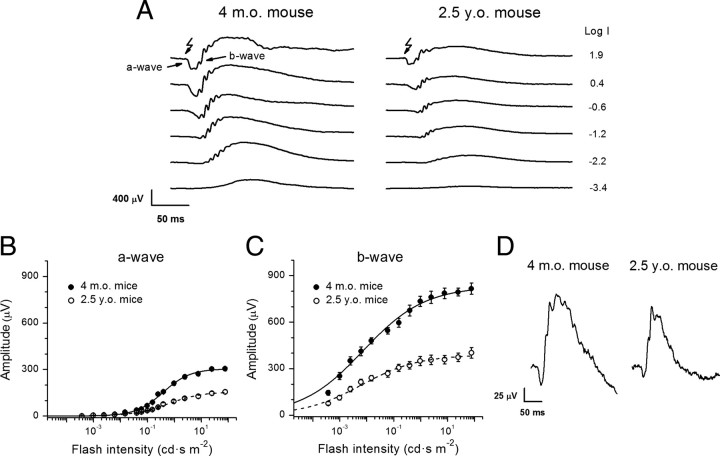
Figure 2.
Analysis of ERG responses in 4-month-old and 2.5-year-old mice. A, Representative families of scotopic ERG recordings from adult (left) and aged (right) mice evoked by white light flashes of increasing intensities, indicated to the right of the traces as the log intensity (in cd · s · m−2). B, C, Amplitudes of scotopic ERG a- (B) and b- (C) waves plotted versus flash intensity. Averaged data from both eyes of six or seven animals of each age group. Values are means ± SEM. The data were fitted by hyperbolic functions (Fulton and Rushton, 1978), as follows: where A max is the maximal amplitude, I is the flash intensity, n is the Hill coefficient, and I h is the half-saturating light intensity. Fitting parameters are summarized in Table 3. D, Population-averaged photopic ERG responses from adult (left) and aged (right) mice evoked by white light flashes (2.7 log cd · s · m−2). Amplitudes of cone ERG a-waves are 39 ± 4 μV (adult mice, n = 4) and 26 ± 3 μV (aged mice, n = 4), and amplitudes of cone b-waves are 191 ± 15 μV (adult mice, n = 4) and 149 ± 16 μV (aged mice, n = 4). The p values are <0.05 for both parameters.

