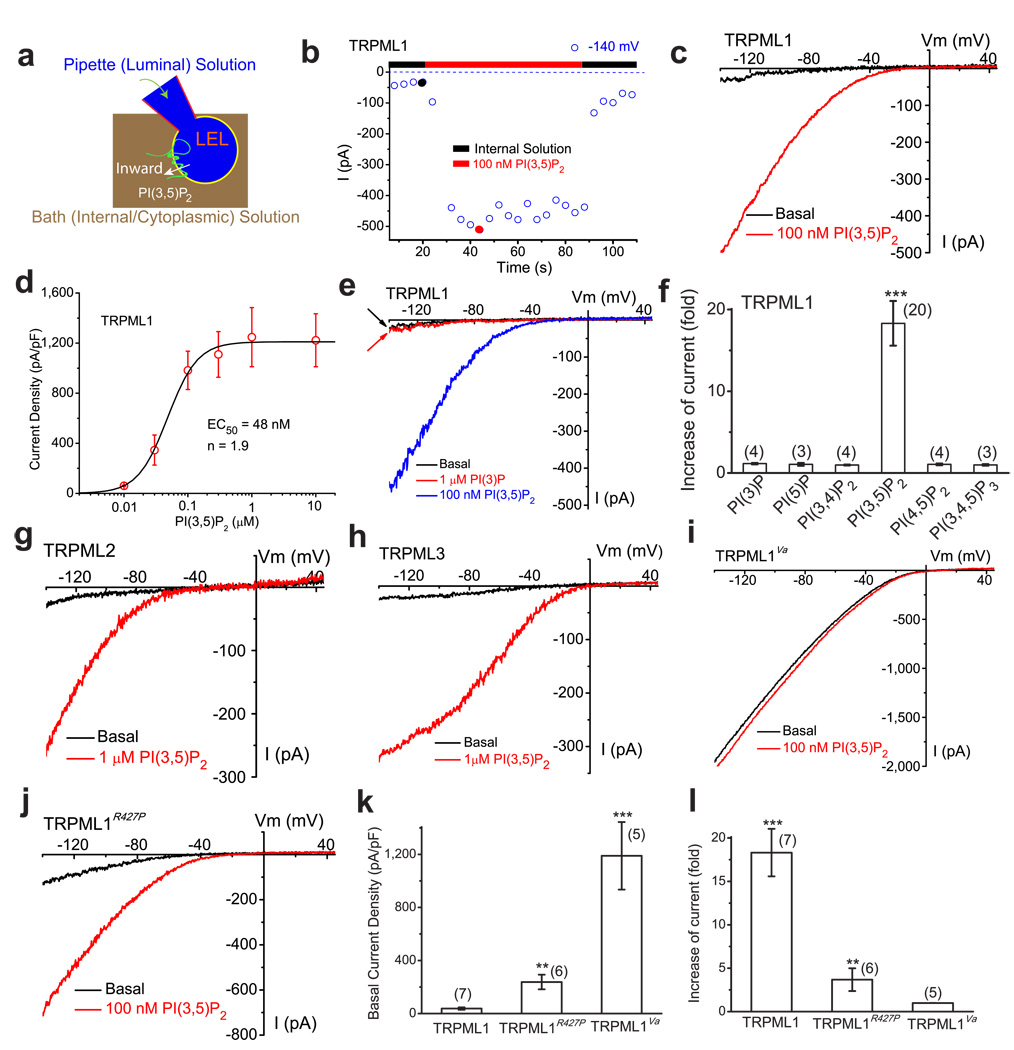
Figure 1. PI(3,5)P2 activates recombinant TRPML channels in the endolysosomal membranes.
a) Illustration of a whole-endolysosome recording configuration. Pipette (luminal) solution was a standard external (Tyrode’s) solution adjusted to pH 4.6 to mimic the acidic environment of the lysosome lumen. Bath (internal/cytoplasmic) solution was a K+-based solution (140 mM K+-gluconate). Putative membrane topology of TRPML channels is illustrated in the late endosome and lysosome (LEL). Note that the inward current indicates cations flowing out of the endolysosome (see red arrow for the direction). b) Bath application of PI(3,5)P2 (diC8, 100 nM) activated inwardly rectifying whole-endolysosome TRPML1-mediated current (ITRPML1) in an enlarged endolysosome/vacuole from a TRPML1-EGFP-expressing Cos-1 cell that was pre-treated with vacuolin-1. ITRPML1 was elicited by repeated voltage ramps (−140 to +140 mV; 400 ms) with a 4-s interval between ramps. ITRPML1 exhibited a small basal current prior to PI(3,5)P2 application; bath application of PI(3,5)P2 to the cytoplasmic side of the endolysosome resulted in maximal activation of 18-fold of baseline within a minute, measured at −140 mV of ITRPML1. c) Representative traces of ITRPML1 before (black) and after (red) PI(3,5)P2 at two time points, as shown in a (black and red circles). Only a portion of the voltage protocol is shown; holding potential = 0 mV. d) Dose-dependence of PI(3,5)P2-dependent activation (EC50 = 48 nM, n = 1.9). e) PI(3)P (1 µM) failed to activate ITRPML1. f) Specific activation of TRPML1 by PI(3,5)P2 ( in 100 nM), but not other diC8 PIPs (all in 1 µM). g) Activation of whole-endolysosome ITRPML2 by PI(3,5)P2 (1 µM). h) Activation of whole-endolysosome ITRPML3 by PI(3,5)P2 (1 µM). i) Whole-endolysosome ITRPML1-Va exhibited high basal activity but was insensitive to PI(3,5)P2 (100 nM). j) Whole-endolysosome ITRPML1-R427P was weakly activated by PI(3,5)P2. k) Basal current amplitudes of whole-endolysosome ITRPML1, ITRPML1-R427P, and ITRPML1-Va. l) Effects of PI(3,5)P2 on ITRPML1, ITRPML1-R427P, and ITRPML1-Va. For histogram graphs of all figures including panels (f, k, l) of this figure, data are presented as the mean ± standard error of the mean (SEM); the n numbers are in parentheses. Statistical comparisons were made using analysis of variance (ANOVA): P value < 0.05 was considered statistically significant and indicated with asterisks (*, 0.01< P < 0.05; **, P < 0.01; ***, P < 0.001).

