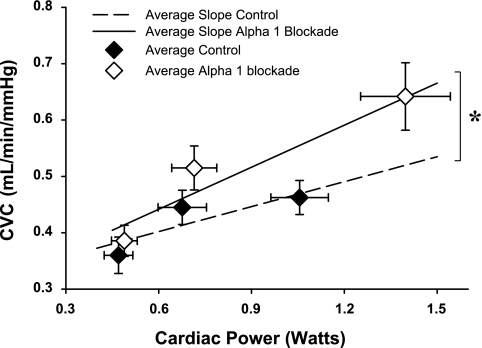
Fig. 4.
CVC plotted as a function of cardiac power. The broken regression line represents the average relationship between CVC and cardiac power in control, whereas the solid regression line represents the corresponding average relationship during α1-adrenergic blockade. ♦, Averaged values in control condition. ◊, Averaged values during α1-adrenergic blockade. Bracket and asterisk signify the significant difference between the 2 slopes (P < 0.05).

