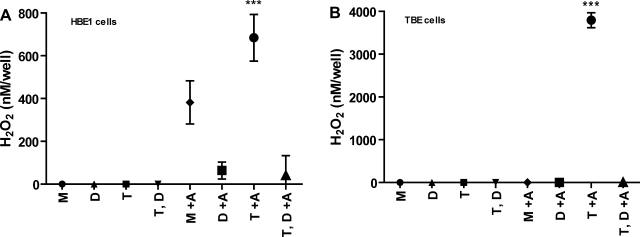
Fig. 4.
Apical H2O2 production in HBE1 and TBE cells treated with or without ATRA. HBE1 cells (A) and primary TBE cells (B) were grown in ALI culture conditions with or without 30 nM ATRA for 7 days followed by measurements of H2O2 using Amplex Red assays: M, media alone; D, diphenyleneiodonium (20 μM); T, thapsigargin (1 μM); and T,D, thapsigargin/diphenyleneiodonium cotreatment. Values are expressed as nM H2O2/well/10 min by comparing with an H2O2 standard curve. Data represent the means and SE of 3 independent experiments with 9 wells per treatment group. ***P < 0.0001 (by ANOVA).

