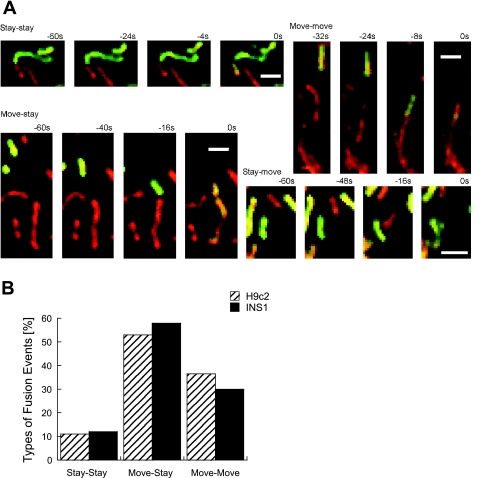
Fig. 5.
Mitochondrial movement and fusion. A: time course of typical mitochondrial fusion events in H9c2 cells: stay-stay, move-move, move-stay, and stay-move. Bar = 2 μm. B: distribution of stay-stay, move-move, move-stay, and stay-move in occurrence of fusion events in H9c2 cells (n = 213) and in INS1 cells (n = 47).

