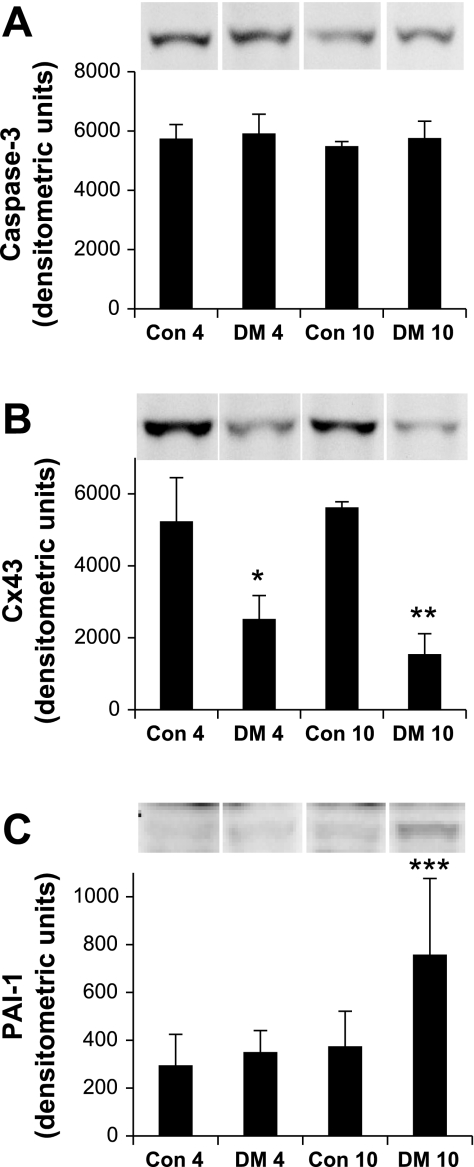
Fig. 4.
Temporal expression of protein markers of cellular stress response mechanisms in the diabetic kidney. A: apoptotic execution caspase-3 expression remains unchanged from controls at both 4 days (left two columns) and 10 days (right two columns) after STZ treatment. B: connexin-43 (Cx43) expression decreases in senescence and significantly decreases in response to STZ treatment at both 4 and 10 days. C: plasminogen activator inhibitor type-1 (PAI-1) expression increases in senescence and remains unchanged at day 4 but is significantly increased at day 10 after STZ treatment. Labels at axes as per Fig. 2. Results represent means ± SE, n = 4, except PAI-1 DM4, where n = 3. Cx43, *Con4 vs. DM4, P = 0.0092; **Con10 vs. DM10, P = 0.0005; PAI-1, ***Con10 vs. DM10, P = 0.0196, and DM4 vs. DM10, P = 0.0212.

