
Figure 2.
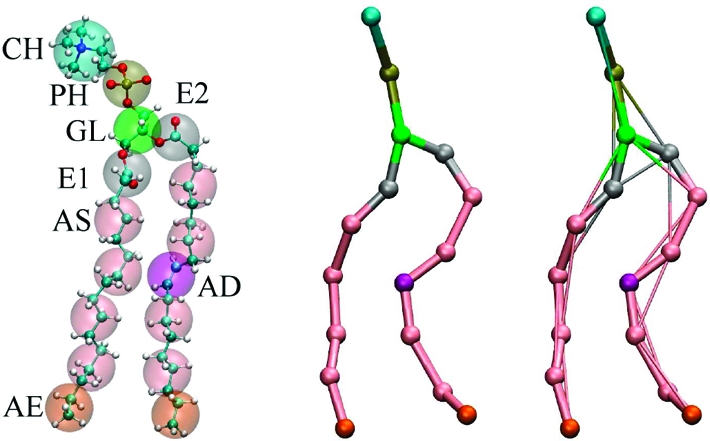
Structure of the POPC lipid molecule. The left panel shows the mapping scheme from AA to CG, the middle panel shows the topology of the lipid molecule in a CG simulation with multibody interactions (where the three-body angle interactons and four-body improper dihedral interactions are not explicitely shown), and the right panel shows the topology of the lipid molecule in which all the multibody interactions have been replaced with effective two-body interactions. Notice that the size of the CG beads in the middle and right panel does not represent the real excluded volume of each bead.