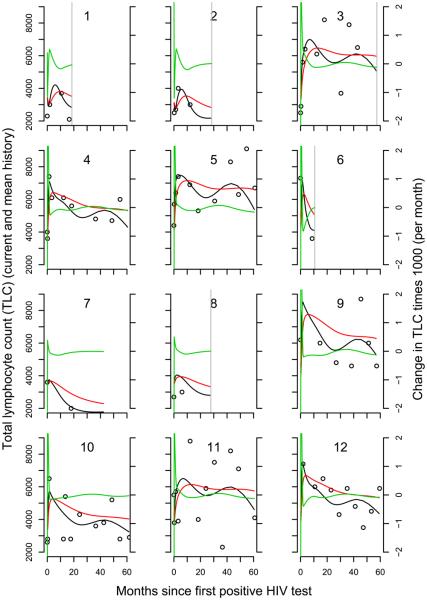
Fig. 3.
Longitudinal profiles of TLC for 16 infants with q = 6. Circles mark the observed values. The solid black line indicates the fitted trajectory from the model. The red line represents the fitted cumulative value. The green line represents the fitted slope. A vertical grey line indicates time of death if it was observed.

