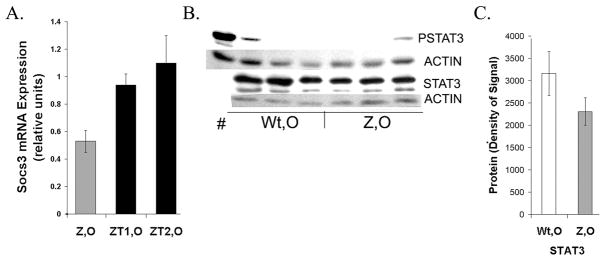
Figure 6.
Expression of Socs3 and STAT3 A. qRT-PCR. Levels of Socs3 mRNA measured in PiZ older or in pooled tumor sets. Values are fold increases relative to age matched Wt non-tumor. See Figures 2 and 4 for symbols and n-values. B. Typical immunoblots of PSTAT3 and STAT3 measured in Wt, O and Z, O. STAT3: 2 isoforms. Actin: loading control. # indomethacin treated, positive control. C. Quantification of typical immunoblot. Signals (densities) were calculated in ImageJ. No significant difference in STAT3, P> 0.05.

