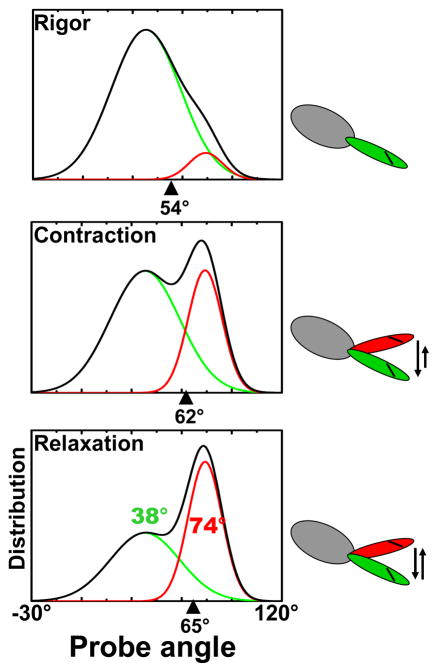
Figure 2.
Distributions of regulatory light chain (RLC)-bound probe angle (relative to fiber axis) detected by EPR in muscle fibers (4). The total distribution (black; mean indicated by black arrowhead) is a linear combination of pre- (red, 74° mean) and post-powerstroke (green, 38° mean) distributions.

