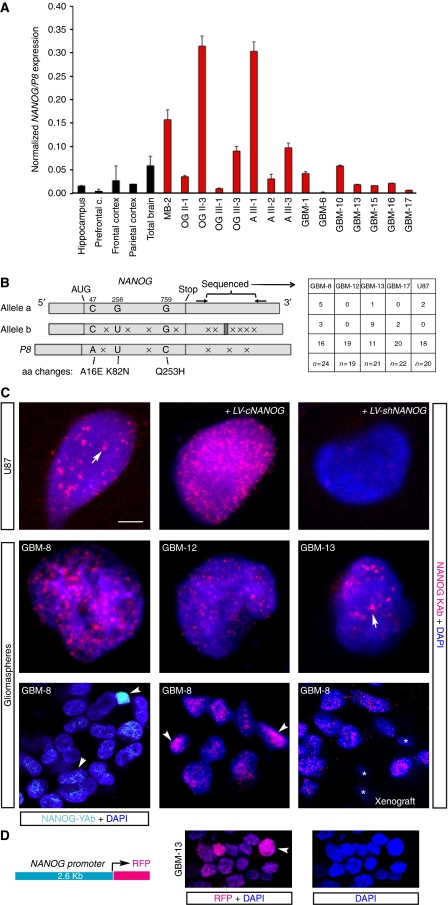
Figure 1.
NANOG expression in human gliomas. (A) Quantification of NANOG/P8 expression by qRT–PCR in normal brain and in different normal brain regions (black bars), and in human brain tumours (red bars): A, astrocytoma; GBM, glioblastoma multiforme; OG, oligodendroglioma; MB, medulloblastoma. Roman numerals refer to WHO tumour grade. Arabic numerals refer to tumour sample as in Clement et al (2007) except GBM-15, -17. Expression values were normalized by using the geometrical mean of TBP and β ACTIN. (B) Diagram of the structure of NANOG alleles a (NW_001838051) and b (NC_000012.11), and of NANOGP8 (NT_010194.17). NANOG allele b contains 22 extra bp in the 3′UTR (dark grey box). These differences suggest the identification of these conserved polymorphic variants as alleles. The diagram also highlights the bp differences (crosses) and the 2 or 3 aa variants. Of these, K82N is not conserved in different species. The right part shows the frequency of alleles as determined from sequencing a portion of the 3′UTR that is diagnostic for the different alleles in different primary GBMs and in U87 cells. (C) Indirect immunofluorescence localization of NANOG protein with YAb (top left) or KAb antibody in patient-derived GBM cells grown as gliomaspheres and attached U87 cells as indicated with confocal microscopy. Nuclei are counterstained with DAPI (blue). Labelling is seen in multiple nuclear puncta (arrows). Cells express NANOG at different levels (arrowheads). Asterisks mark small cells with no labelling that likely represent mouse stromal cells in xenografts. Control staining was performed on LV-cNANOG- and LV-shNANOG-1-transduced cells (top right) and on cells that lacked primary antibodies (see Supplementary Figure S1). (D) Scheme of the NANOG reporter construct used to drive RFP expression (left) and the resulting RFP fluorescence (red) (middle; a high-expressing cell is denoted by an arrowhead) in a small GBM-13 gliomasphere derived from a transduced cell. The sphere was allowed to attach to the dish for 30 min before processing. The same image is shown only with DAPI staining (blue; right) to highlight nuclei. Scale bar=3 μm (C, top and middle rows), 10 μm (C, bottom row), 15 μm (D).

