Figure 2.
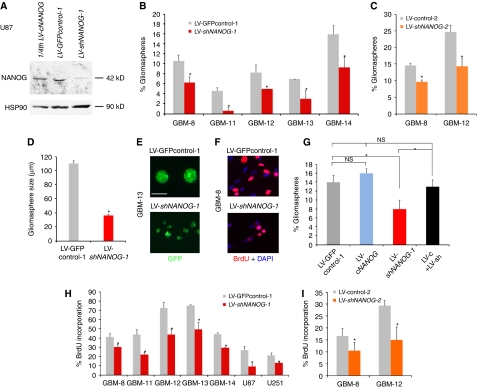
NANOG regulates stem cell self-renewal and GBM cell proliferation. (A) Western blot of U87 cells expressing LV-GFPcontrol-1, showing endogenous levels of NANOG protein (middle), LV-cNANOG (left; with only 1/4th, 20 μg, of the amount of total protein as in the other lanes loaded; expressing NANOG cDNA) and LV-shNANOG-1 (right, 80 μg), with greatly reduced NANOG protein levels. (B, C) Quantification of clonogenic single-cell gliomasphere formation by transduced GBM samples after expression of shNANOG-1 (B), shNANOG-2 (C) or controls (LV-GFPcontrol-1 (B) or LV-control-2 (C)); >900 clonogenic events were counted per condition, plated in 96-well plates. (D, E) Representative photomicrographs of GFP+ (green) gliomaspheres in suspension (E) and measurement of their sizes (D) from GBM-8 cells transduced with LV-GFPcontrol-1 or LV-shNANOG-1 as indicated. (F) Representative examples of anti-BrdU labelling (red) in GBM-8 cells transduced with LV-GFPcontrol-1 or LV-shNANOG-1 as indicated. GBM-8 gliomaspheres were dissociated and allowed to attach to facilitate immunohistochemistry and counting. (G) Histograms showing the quantification of the rescue of the inhibition of clonogenicity by shNANOG-1 through the overexpression of NANOG cDNA (LV-cNANOG) in GBM-12 gliomaspheres. (H, I) Quantification of BrdU incorporation in multiple primary GBM and GBM cell lines after NANOG kd with shNANOG-1 (H) or shNANOG-2 (I), shown in comparison with controls (GFP-control-1 (H) or control-2 (I)). Asterisks denote significative changes (P<0.05). ns, not significative. Error bars represent s.e.m. For clonogenic (sphere) assays, 900 clonogenic events were counted per condition. Scale bar=120 μm (E), 45 (F).

