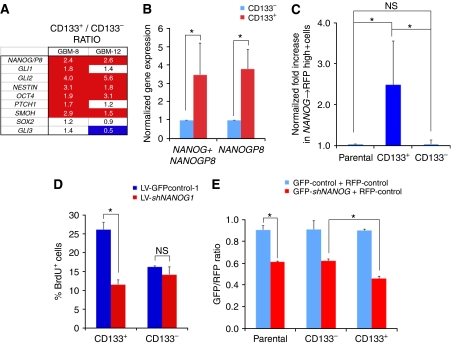
Figure 3.
Expression and function of NANOG in CD133+ GBM cells. (A) Gene expression levels determined by RT–qPCR shown as the ratios of the expression values of CD133+ cells over those of CD133− cells, of GBM-8 and GBM-12 cells, after normalization with housekeeping genes. Enhanced levels ⩾1.5-fold are in red and repressed levels ⩽50% are in blue. CD133+ cells express higher levels of NANOG/P8 as compared with CD133− cells. (B) Quantification of the levels of mRNA expression of NANOG/P8 (NANOG + NANOGP8) and of NANOGP8 alone in freshly MACS-sorted CD133+ versus CD133− GBM-8 cells. Normalization was set so that CD133− levels equal 1. NANOGP8 shows a similar enrichment to that of the combined genes in CD133+ cells. (C) Normalized enrichment of NANOG → RFP+ cells in CD133+ versus CD133− GBM-8 cells. Normalization was performed by equating the level in the unsorted parental population to 1. (D) Acute (16 h) BrdU incorporation assay on freshly sorted CD133+ and CD133− cells of GBM-8 showing a selective effect of NANOG kd in CD133+ cells at this early time point. (E) Red/green competition assay in vitro testing for the changes in GFP+ experimental cells co-expressing shNANOG-1 or controlGFP-1 versus RFP+-control cells. Cells were transduced, FACS sorted to obtain 100% transduced cell populations, mixed and 5 days later sorted for CD133 by MACS. MACS-sorted cells were then FACS analysed to determine the relative GFP/RFP ratios per culture condition shown in the graph. Asterisks denote significative changes (P<0.05).

