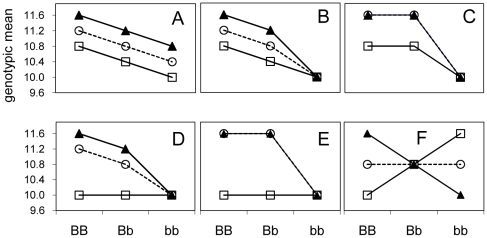
Figure 1. Molecular Epistasis: Two-locus models used in the simulations.
The X axis separates the three genotypes at one locus (BB, Bb and bb) while the three lines indicate the different genotypes at the other locus (AA-triangles, Aa-circles and aa-squares). In panel a the effects of both loci are additive (no epistasis). In panel b the effect of the bb combination masks the effect of the A locus - this is an example of recessive epistasis. In panel c recessive epistasis is combined with dominance of the A allele at the A locus, in panel d both the aa and bb combinations exhibit recessive epistasis. In panel e the recessive epistasis of the aa and bb combinations is combined with dominance at the A locus. In panel f, additive-by-additive epistasis, the effects are purely epistatic- under equal allele frequencies this results in the absence of main effects at the A or B locus.

