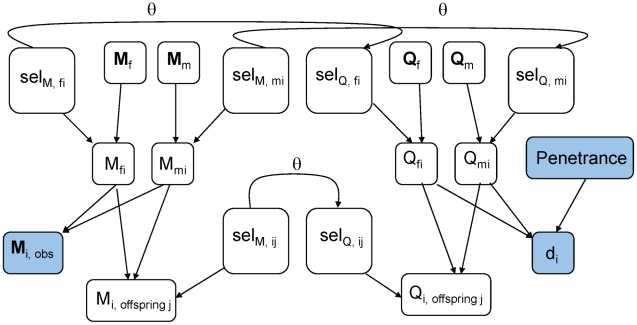
Figure 1. The graphical model for the Gibbs sampler.
All variables shown here are involved in updating the information for individual i. Filled-in variables are typically observed, and held constant throughout the run of the sampler.  marker alleles that i received from its father and mother.
  disease locus alleles that i received from its father and mother.
  ,
,  marker and disease locus alleles that individual i passed to its jth offspring. (Only one offspring is shown for illustration.)
  individual i's phenotype.
  Selector variable: tells whether i's paternal marker allele comes from its paternal grandfather or grandmother.
  's unphased marker genotype.
  ,
,  marker genotype vectors of i's mother and father. If i is a founder, replace by a constant node describing the population allele frequencies. Penetrances = matrix of the probabilities of each phenotype, conditional on disease genotype; held constant.

