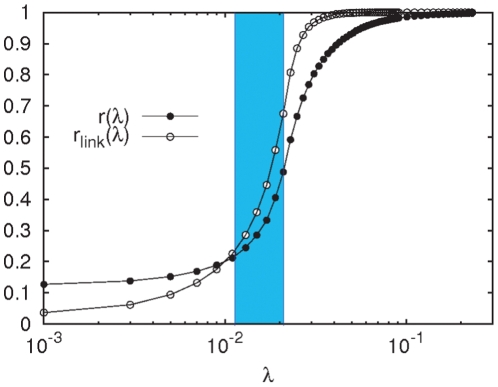
Figure 2. Synchronization diagrams.
The figure shows the evolution of the Kuramoto order parameter  and the fraction of synchronized links
  as the coupling strenght is increased. The transition from asynchronous dynamics to global dynamical coherence as
  grows is clear from the two curves. The region in blue corresponds to the onset of synchronization.

