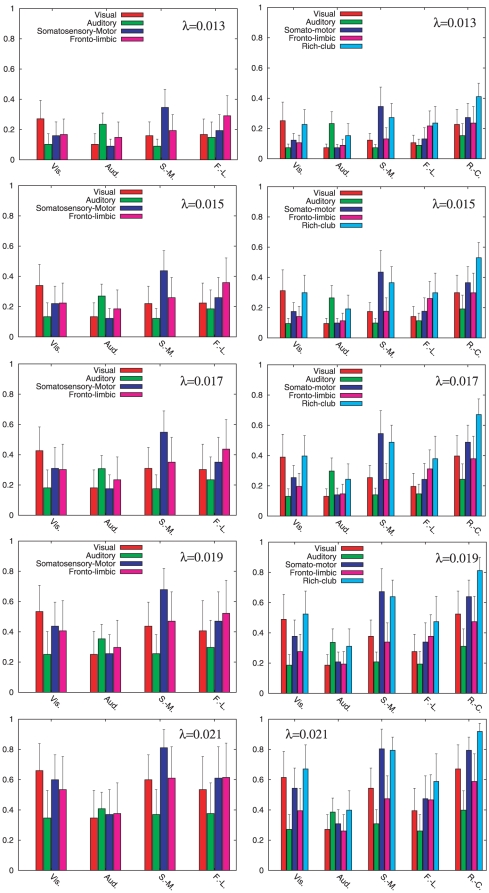
Figure 4. Dynamical correlation within the  modal clusters (left column) and the
  dynamical clusters (right column) at the onset of synchronization.
The bars of the histograms show the values of the dynamical correlation  (see Equation (2)) between the
  modules (left) and the new
  modally-related clusters and the Rich-Club (right). From top to bottom we show the cases for
  ,
,  ,
,  ,
,  and
and  that correspond to the onset of synchronization.

