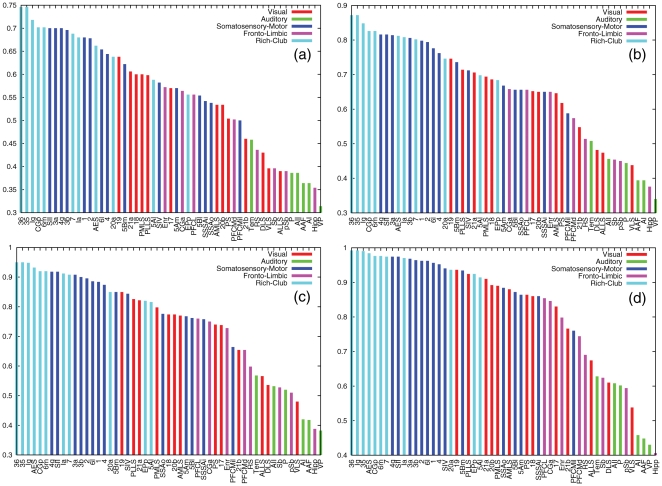
Figure 6. Synchrony Rank of areas: Structure of the largest synchronized areas as described by the Rich-Club.
The two plots show the same synchrony ranks as in Figure 5 (again  (a),
(a),  (b),
(b),  (c) and
  (d)). We have recolored the bars of those areas corresponding to the Rich-Club to highlight the dominant role of this topological structure in the composition of the largest synchronized areas.

