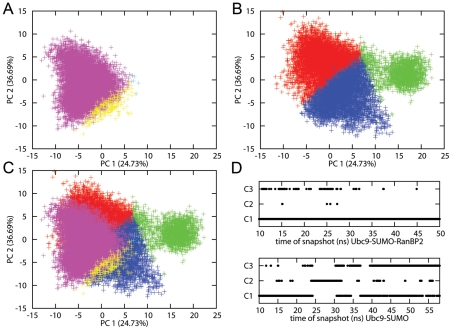
Figure 4. Projection of Ubc9 conformations on principal components.
The PCs are given in Å. The proportion of all trajectory accounted for by the PCs up to current PC is given in parenthesis on each axis. (A–C) x-axis is PC1, y-axis PC2. (A) Ubc9 conformations from the Ubc9-SUMO-RanBP2 simulation, projected on PC1 and PC2. Members of cluster 1 in magenta, cluster 2 in cyan, cluster 3 in yellow. (B) Ubc9 conformations from Ubc9-SUMO simulation, projected on PC1 and PC2. Members of cluster 1 in red, cluster 2 in green, cluster 3 in blue. (C) Merged plot of A and B, with same color coding. (D) The distribution of cluster members in time, x-axis time, y-axis cluster number. Upper lane is Ubc9-SUMO-RanBP2, and lower lane is Ubc9-SUMO.

