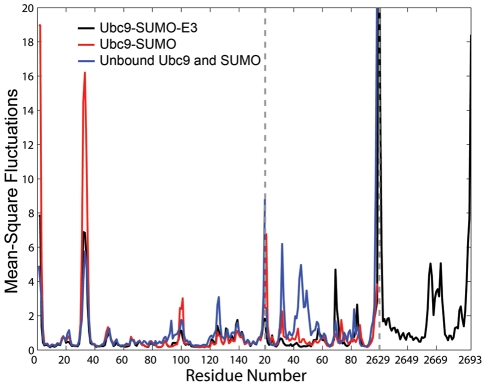
Figure 5. Mean square fluctuations from unbound Ubc9 (blue), unbound SUMO (blue), Ubc9-SUMO complex (red) and Ubc9-SUMO-RanBP2 complex (black) simulations.
The x-axis gives the residues numbers for each chain, where the dashed lines on the figure mark the separations between chains. Although coded in the same color, the results for unbound Ubc9 and unbound SUMO are from separate simulations, details of which are given in Methods and Text S1.

