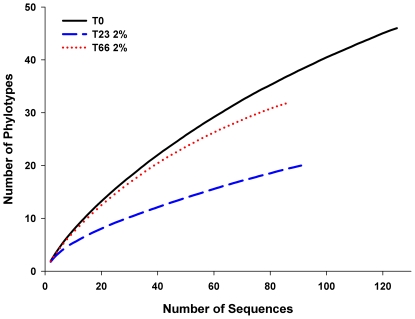
Figure 1. Rarefaction curves of partial sequences of 18S rDNA.
The rarefaction curves from microcosm sediment samples were calculated by DOTUR003. T0, T23 2% and T66 2%: curves of 18S rDNA of each sampling T0, without oil contamination; T23 2%, 23 days after 2% of oil contamination; T66, 66 days after 2% of oil contamination.

