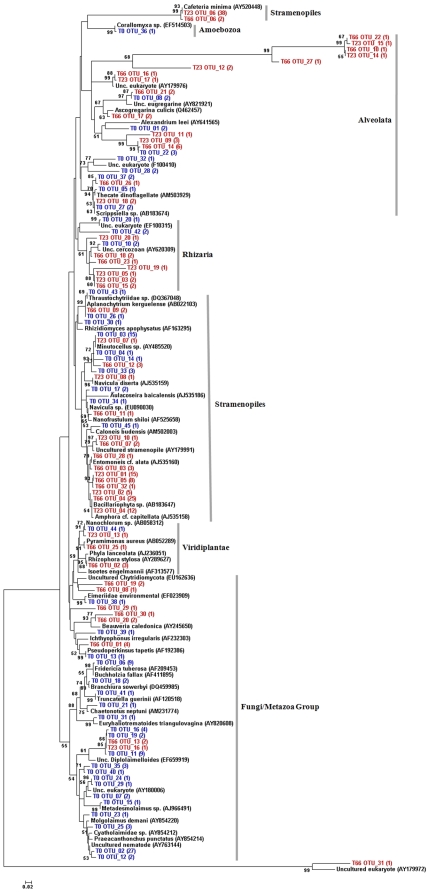
Figure 3. Phylogram of the microeukaryotic 18S rRNA phylotypes obtained from the microcosm sediment samples.
A representative sequence of each OTU determined by DOTUR003 and the nearest neighbours obtained by using the aligner tool of the SILVA database project were used OTUs nomination: T0, without oil contamination (in blue); T23 2%, 23 days after 2% of oil contamination (in red); T66, 66 days after 2% of oil contamination (in red) The phylogram was calculated with MEGA 40 using the neighbour-joining method and the Jukes-Cantor model Numbers at the branches show the bootstrap percentages (above 50% only) after 1000 replications of bootstrap sampling.

