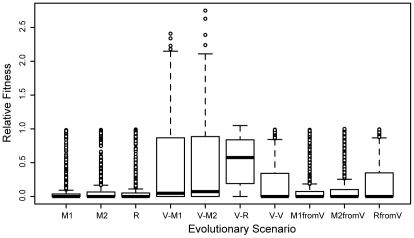
Figure 4. Distribution of relative fitness for single knockouts in networks resulting from different evolutionary scenarios.
Each distribution contains measurements from 100 networks and is shown as a boxplot, as implemented in the statistical package “R” (www.r-project.org). See legend of Figure 1 for analysis and naming details. To statistically analyze differences between the distributions, we performed pair-wise Kolmogorov-Smirnov tests. As expected, differences between equivalent distributions were statistically not significant (M1 vs. M2: p≈0.6; M1fromV vs. M2fromV: p≈0.3; V-M1 vs. V-M2: p≈0.7). The fitness distribution for R networks is highly similar to M1 and M2 (p≈0.96 and 0.8, respectively). The distributions M1fromV and M2fromV are similar to the distributions M1, M2 and R, with indication for statistically significant differences: Four of the pair-wise comparisons yield p-values larger than 0.1; while two comparisons yield p-values below 0.05 (M2fromV vs. M1: p≈0.026; M2fromV vs. R p≈0.008). All other pair-wise comparisons show statistically highly significant differences, with all p-values smaller than 0.0001.

