
Figure 2.
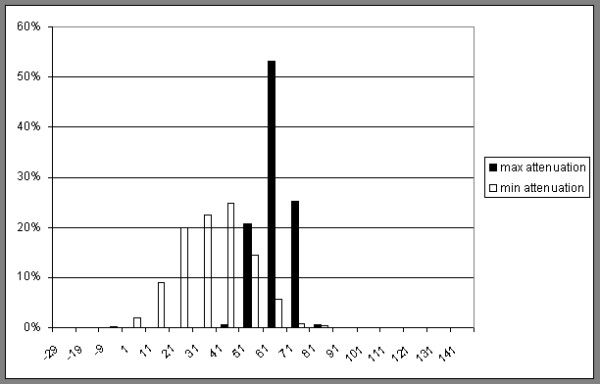
Relative distribution of attenuation values in HU of gracilis. Two examples chosen, with the highest and lowest mean attenuation included in the study respectively. Both are measured by drawing a line just inside the border of the muscle to avoid volume averaging at the border affecting the result.