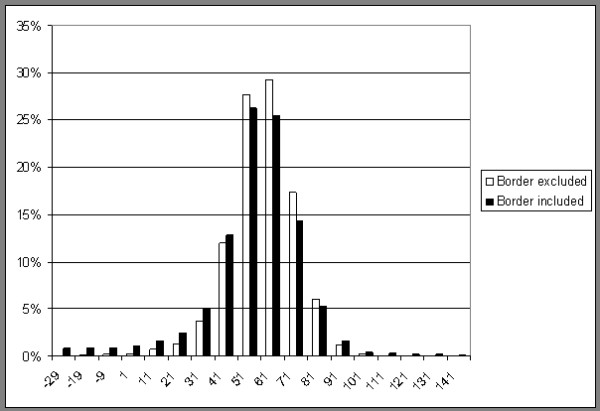
Figure 5.

Relative distribution of attenuation values in HU for quadriceps. One example evaluated in two different ways by drawing a line just inside the border of the muscle (border excluded) and by drawing a line just outside the border of the muscle (border included) Relative distribution of attenuation values in HU for quadriceps One example evaluated in two different ways by drawing a line just inside the border of the muscle (border excluded) and by drawing a line just outside the border of the muscle (border included).
