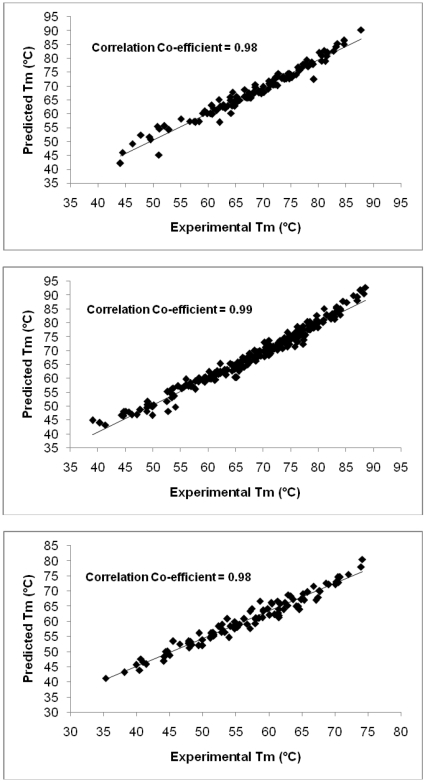
Figure 1. Correlation plots between the experimental and predicted melting temperatures. Figure 1(a).
Correlation between predicted and experimental melting temperatures for the training dataset of 123 oligomers Figure 1(b) . Correlation between predicted and experimental melting temperatures for the test dataset of 225 oligomers Figure 1(c) . Correlation between predicted and experimental melting temperatures for an additional dataset of 100 oligomers (15-mers) adapted from Ref. 38.

