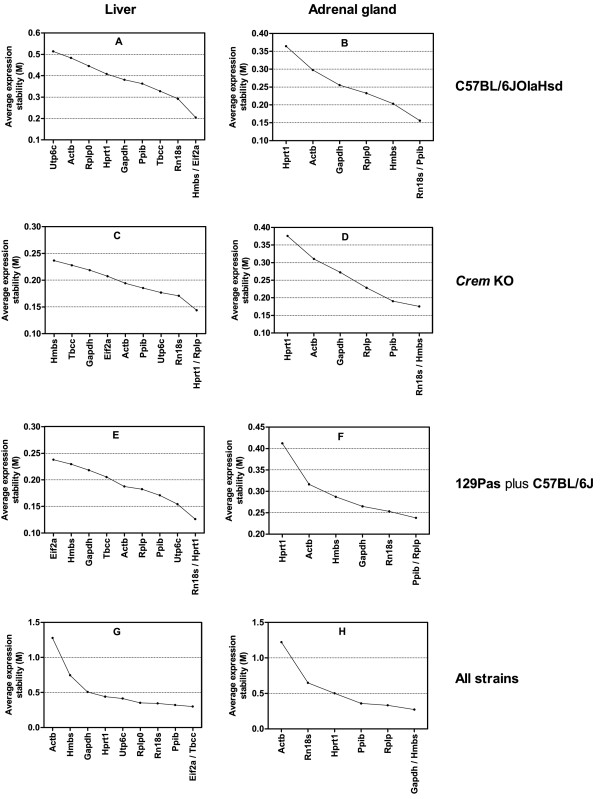
Figure 2.
Expression stabilities and ranking of reference genes in individual groups according to geNorm. Groups A to F enable determination of reference genes for circadian experiments within separate tissues and mouse strains. Data is divided according to tissue type (liver and adrenal gland) and mouse strain. The remaining two groups (G and H) were used to identify reference genes when comparing different mouse strains. Figures are divided according to tissues (liver and andrenal glands) and mouse strain. Crem KO is on the 129Pas plus C57BL/6J background. Graphs G and H represent reference genes from joint data of all strains.

