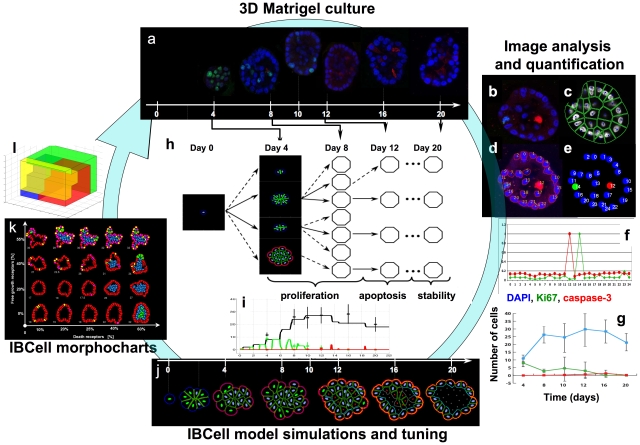
Figure 1. A quantitative integrative approach to model the development of normal acini and their mutants.
(a) 3D Matrigel culture of non-tumorigenic epithelial breast cell line MCF10A. The representative data at days: 4, 8, 10, 12 16 and 20 show central cross sections through the developing acini stained for cell nuclei (DAPI, blue), cell proliferation (Ki67, green) and cell apoptosis (caspase-3, red). Quantitative image analysis: (b) confocal microscopy images stained for DAPI, Ki67 and caspase-3 are (c) segmented using the BioSig software and (d) used to delineate cell nuclei. BioSig is used to identify the intensities (f) of red and green wavelengths in each nuclei that allows for reconstruction (e) of proliferative and apoptotic events in the stained acinus and for determination of counts of growing (green), dying (red) and the total number (blue) of cells during the whole course of the experiment (g). The computational IBCell model of acinar morphogenesis has been tuned with MCF10A data by constructing the search tree (h) that identifies several model parameters (tree branches) generating the desired structures and cell counts on the consecutive time points. (i) The evolution of growing (green), dying (red) and the total number of cells (black) arising during the MCF10A-tuned simulation; stars represent the average value from experimental data. (j) The simulated morphologies at the days corresponding to experimental data; nuclear staining: viable cells (blue), growing (green), dying (red); membrane receptor staining: adhesive receptors (green), growth sensors (blue), ECM receptors (pink-red-orange depending on ECM concentration), apical markers (cyan), death receptors (grey). (k) 2D morphocharts showing a collection of final acinar morphologies arising for different combinations of growth and death sensors thresholds; (l) 3D morphochart parameter space representing combinations of growth, death and ECM sensor thresholds that result in normal (red region), not-hollow (blue), degenerate (yellow) and non-stabilized (green) acini.

