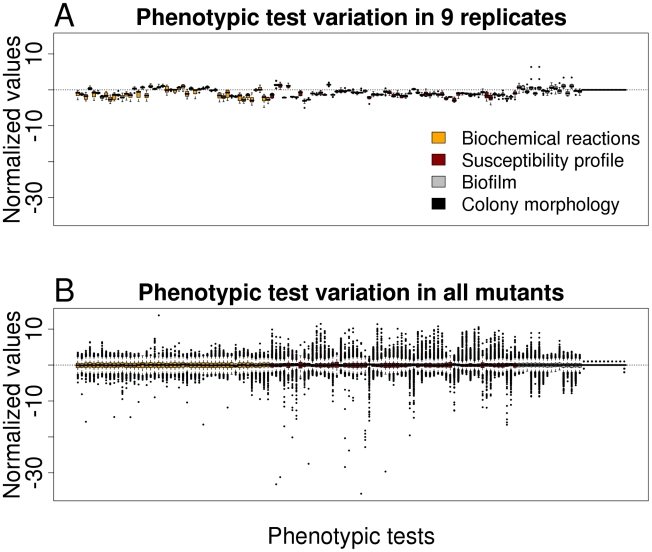
Figure 1. Variation in phenotypic tests.
(A) Boxplot representation for preprocessed phenotypic data of nine replicates (PA14 wild-type harboring a spontaneous mutation within flgF) for all 136 phenotypic tests. (B) Boxplot representation of preprocessed phenotypic data of all mutants for all 136 phenotypic tests. The low variation of the replicates indicates the robustness of the testing system, whereas the high variation in all mutants reflects the discriminative potential for each test.

