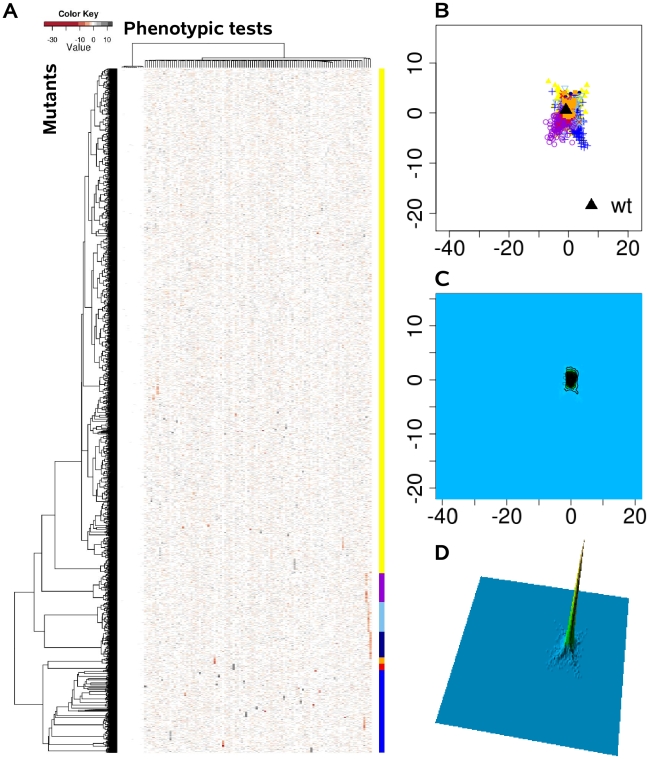
Figure 3. The phenome landscape for permutated values.
Phenotypic distances between randomly shuffled values served as the basis for hierarchical clustering and multi-dimensional scaling. (A) Heat map, rows correspond to mutants and columns to different phenotype test. (B) Projection onto a two-dimensional grid using multi-dimensional scaling (MDS). Point colors were overlaid by seven cluster groups. (C) MDS was converted to a contour image using two-dimensional kernel density estimation. Altitudes indicate the density of mutants in the MDS grid. (D) The contour image was depicted as a three-dimensional landscape. In comparison to Figure 2 the different cluster group symbols spread homogeneously and in smaller space.

