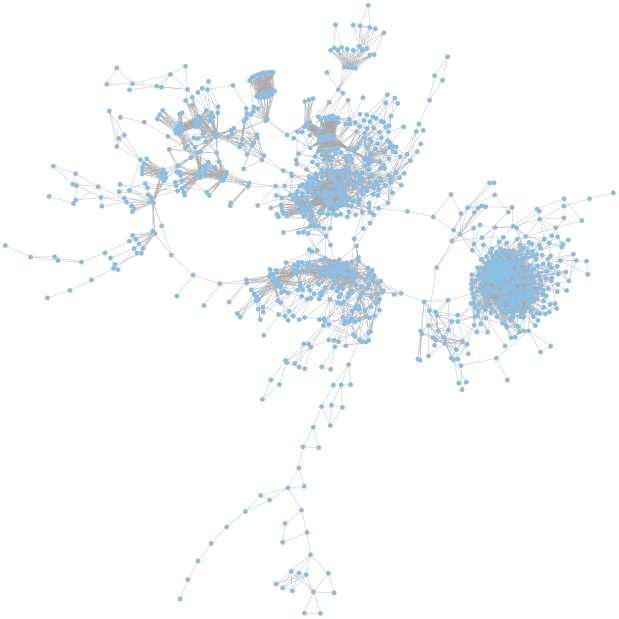
Figure 4. The global phenotypic network.
The network is based on calculated Jaccard indices (JIs), a measure for gene relatedness. In the largest coherent graph 1196 genes are represented by the nodes and the connections between the genes are drawn for gene pairs with JI>0.51. A zoomable graph with gene names is provided in the supporting information (Figure S1).

