
Figure 3.
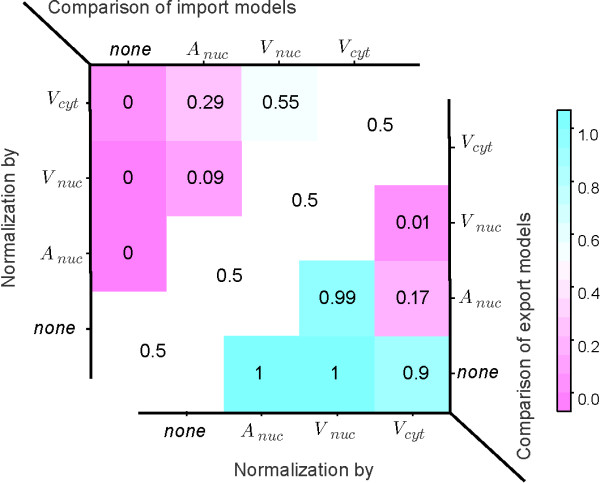
Pairwise import/export model comparison. Plot of the estimated significance of model difference for pairwise compared import models (upper left triangle) and export models (lower right triangle). Values q < 0.5 indicate superiority of the model on the vertical axis compared to the model on the horizontal axis at a confidence level of 1 - q. Accordingly for values q > 0.5.