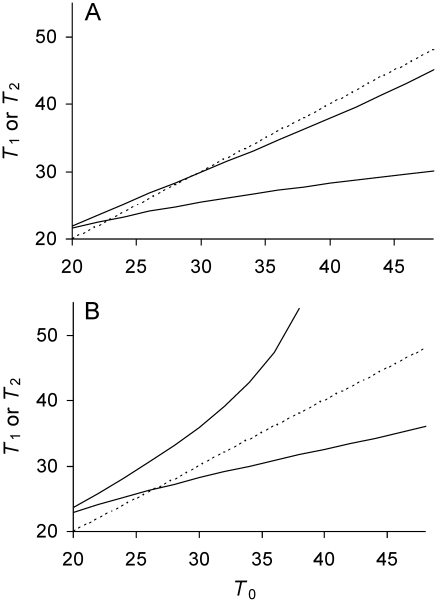
Figure 2. Relationship between doubling times of daughter and mother cells when division is asymmetrical.
See Table 1 for definitions and Figure 1 for details and graphical projections. Identity line (----). With asymmetry, daughters 1 and 2 have different doubling times T
1 and T
2. Upper solid line is T
2 (——); bottom solid line T
1. (A) Low damage rates; a = 0.37, Π = 20, λ = 0.005, and Πλ = 0.10. Because Πλ<1/6 and a is sufficiently large (Table 1), Equations 9a and 9b are satisfied, both solid lines intercept the identity line.  and
and  attain real values that are stable equilibria. If projected graphically as in Figure 1, T
1 and T
2 each converges to its equilibrium. (B) High lifetime damage rates; a = 0.37, Π = 20, λ = 0.0085, and Πλ = 0.17. Because Πλ>0.17 and a is sufficiently large, only Equation 9a is satisfied (Table 1).
  attains a real value and stable equilibrium, but
  cannot and T
2 would be projected to increase to infinity.

