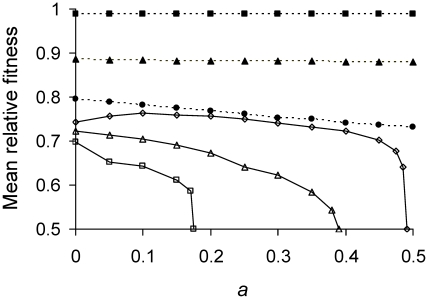
Figure 3. Mean relative fitness as function of asymmetry for varying lifetime damage rates.
Πλ<1/6 (——); Πλ = 0.01 (▪), 0.1(▴), and 0.165 (•). Πλ>1/6 (----); Πλ = 0.17 (□), 0.21(Δ), and 0.24 (○). The highest fitness of 1 denotes a cell that divides into two daughters in Π minutes, the shortest possible doubling time manifested by a damage-free cell. The lowest fitness of 0.5 corresponds to a severely damaged cell that is alive but no longer able to divide. Thus, after Π minutes, former cell contributed two counts to the population while the latter contributed only one. Mean relative fitness  was obtained by simulating a population of cells under selection until a fitness equilibrium. The simulation tracked the doubling times of 1000 individual cells by applying Equations 3, 5, and 6. Selection was allowed to operate by having cells with shorter doubling times divide sooner. The population was randomly culled back to a size of 1000 immediately after the division of any cell. T
1 and T
2 values for individual bacterium were obtained from the simulation, converted to relative fitness (Equation 12), and averaged to obtain
  , which remains a function of Πλ because the use of Equations 6 and 12 combine Π and λ into a product. The random culling renders death a stochastic process in the estimation of
  . Simulations were also performed with a smaller population size of 200 individuals and no differences were obtained, which indicates that the outcome was due primarily to deterministic and not stochastic factors.

