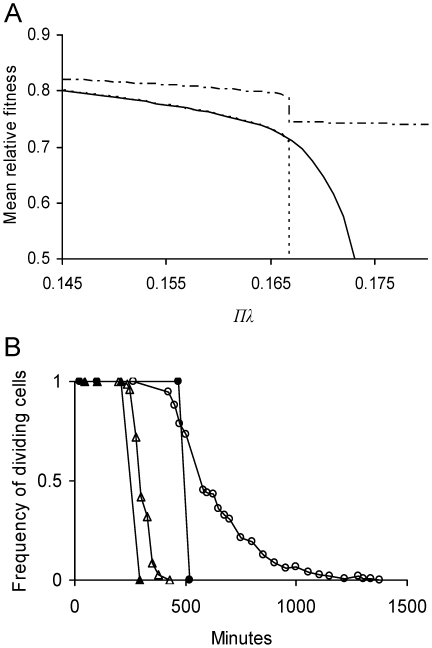
Figure 5. Predicted effect of lifetime damage rate on fitness and persistence of E. coli cells.
(A) Equilibrium mean fitness  as a function of lifetime damage rate Πλ and asymmetry coefficient a. See Figure 3 for methods used in determining
  . A value of
  denotes again no cell division. Because a symmetrical cell is unable to divide if Πλ>1/6 (Equation 11), its equilibrium mean fitness drops to 0.5 as Πλ increases to the threshold (----). Because asymmetry allows bacteria to tolerate a higher damage rate (Table 1), E. coli with its estimated asymmetry of a = 0.4836 (see Estimating Model Parameters), it is able to divide up to Πλ = 0.173 (——). For the estimated values a = 0.4836 and Πλ = 0.1467,
  . For a symmetrical cell with equivalent lifetime damage (a = 0.5 and Πλ = 0.1467),
  . Thus, the evolved asymmetry estimated for E. coli only elevates
  by a difference of 3×10⁻⁵, which is too small to resolve in the figure. However, the advantage of evolving an extreme asymmetry is great because a cell with a = 0 is able to divide over the entire range of presented Πλ values (— - —). (B) Frequency of dividing cells as a function of time for damage-free cells suddenly challenged with a high damage rate. Results compare a symmetrical cell and one with the asymmetry estimated for E. coli. Frequency of dividing cells was determined by iterating the model over successive generations in an initially damage-free population. Cells were considered non-dividing when their doubling times became infinitely long. If Πλ = 0.175, symmetrical cells were unable to divide after 516 min (—•—) while an E. coli equivalent was able up1378 min (—○—), a 63% advantage. If Πλ were elevated to 0.185, symmetrical cells stopped after 296 min (—▴—) and an E. coli equivalent after 426 min (—▵—), a 31% advantage.

