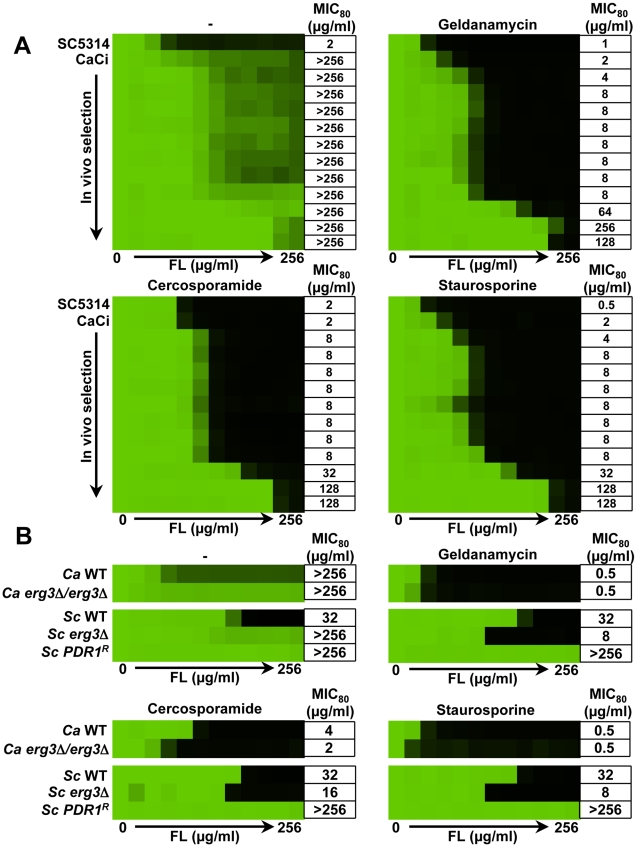
Figure 8. Inhibition of PKC signaling phenocopies inhibition of Hsp90 reducing azole resistance.
(A) Fluconazole (FL) resistance of clinical isolates is abrogated by inhibition of Hsp90 or Pkc1. MIC assays were conducted in YPD medium with no inhibitor (-), with the Hsp90 inhibitor geldanamycin (5 µM), or with the Pkc1 inhibitors cercosporamide (12.5 µg/ml) or staurosporine (0.5 µg/ml). Clinical isolates (CaCi) are ordered sequentially with those recovered early in treatment at the top and those recovered late at the bottom; the FL-sensitive strain SC5314 is included as a control. Data was analyzed after growth for 48 hours at 30°C as in Figure 1A. (B) Inhibition of Hsp90 or Pkc1 abrogates FL resistance of both S. cerevisiae and C. albicans erg3 mutants. Inhibition of Hsp90 or Pkc1 has no effect on the FL resistance of a S. cerevisiae strain (PDR1R) that overexpresses multiple drug efflux pumps due to an activating mutation in the transcription factor Pdr1. FL MIC assays were carried out in YPD medium only (-) or in YPD with fixed concentrations of: geldanamycin (Sc: 5 µM; Ca: 0.625 µM), cercosporamide (Sc: 50 µg/ml; Ca: 25 µg/ml), or STS (Sc: 0.625 µg/ml; Ca: 0.3125 µg/ml). Data was analyzed after growth for 48 hours at 30°C as in Figure 1A. The minimum drug concentration that inhibits growth by 80% relative to the no-FL growth control (MIC80) is indicated for each strain.

