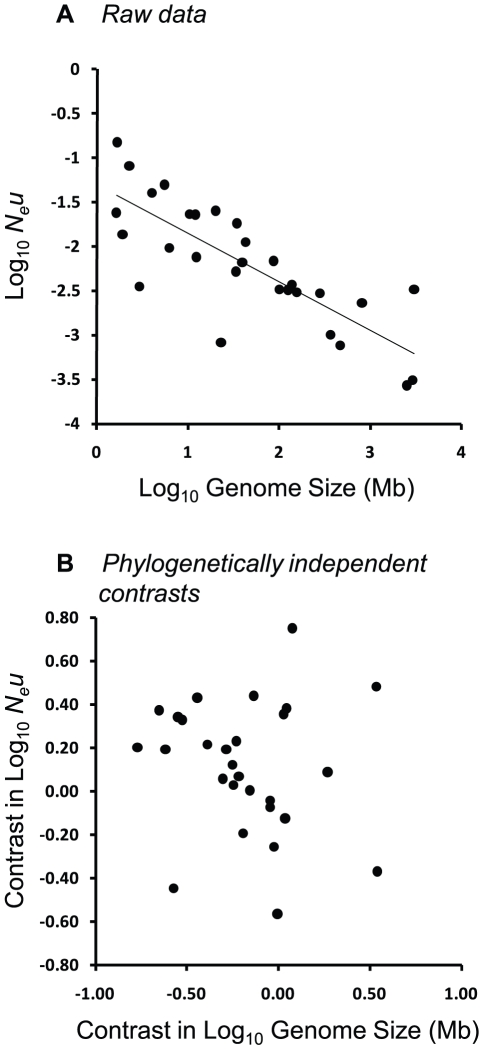
Figure 3. Relationship between Neu and genome size across 22 eukaryotic and 7 prokaryotic species from the dataset of Lynch & Conery [7].
(A) Ordinary least squares regression (OLS); r2 = 0.64, P<0.0001. (B) Standardized phylogenetically independent contrasts (equivalent to PGLS) using branch lengths of 1.0; r2 = 0.08, P = 0.138. Values have been “positivized” on the x-axis [35].

