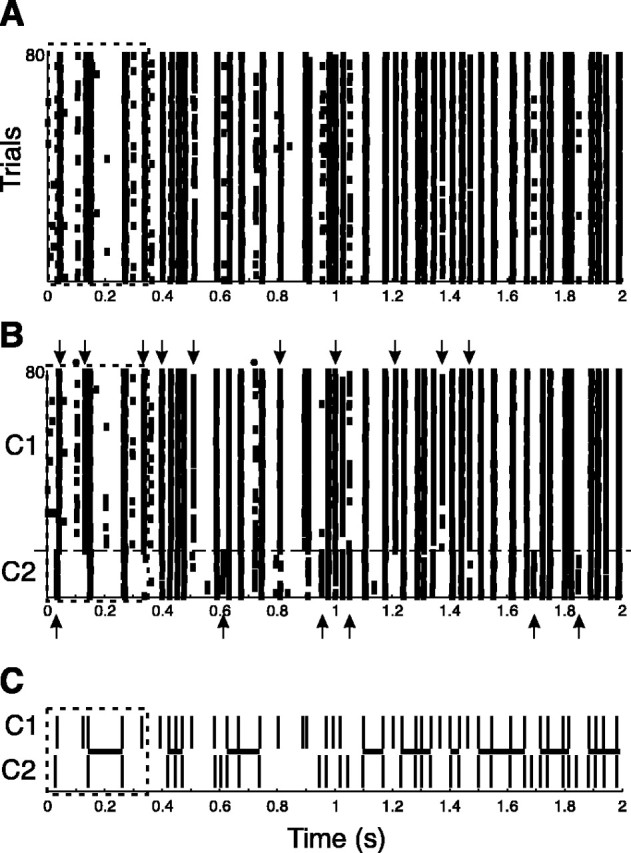
Figure 7.

Evidence for spike patterns in cat LGN in vivo. A, Rastergram of an LGN ON X cell recorded in vivo in the anesthetized cat. The receptive field of the cell was presented with 128 repetitions of the same 8 sec long visual stimulus (for clarity, only 80 of 128 trials for the first 2 sec are shown). The clustering algorithm was applied to this data, assuming the presence of two clusters on the first five events. B, Reordered rastergram showing two strong clusters. Arrows point to events that were present in one cluster but not the other. C, Plot of the reliable events in each cluster (vertical bars). The dashed boxes indicate the region that yielded maximal cluster strength, and the horizontal lines show the regions where the two patterns overlap (within a 5 msec window).
